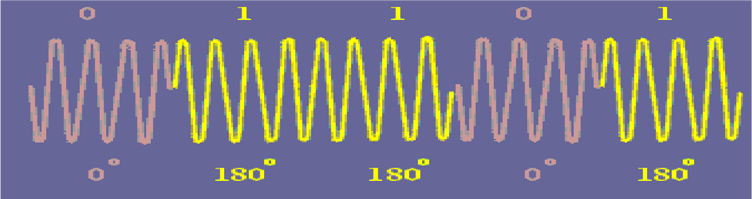
Binary Phase Shift Keying (BPSK) is a type of digital modulation technique in which we are sending one bit per symbol i.e., ‘0’ or a ‘1’. Hence, the bit rate and symbol rate are the same. Depending upon the message bit, we can have a phase shift of 0o or 180o with respect to a reference carrier as shown in the figure above.
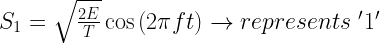
For example, we can have the following transmitted band-pass symbols:
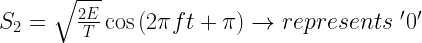
or
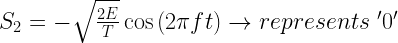
Where ‘E’ is the symbol energy, ‘T’ is the symbol time period, f is the frequency of the carrier. Using Gram-schmidt orthogonalization, we get a single orthonormal basis function, given as:

Hence, the resulting constellation diagram can be given as:
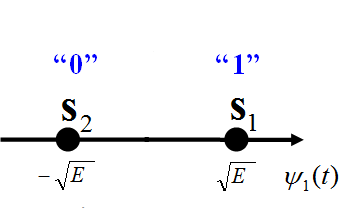
There are only two in-phase components and no quadrature component.
Now, we can easily see that the two waveform of So and S1 are inverted with respect to one another and we can use following scheme to design a BPSK modulator:
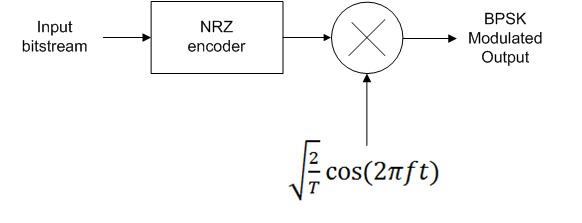
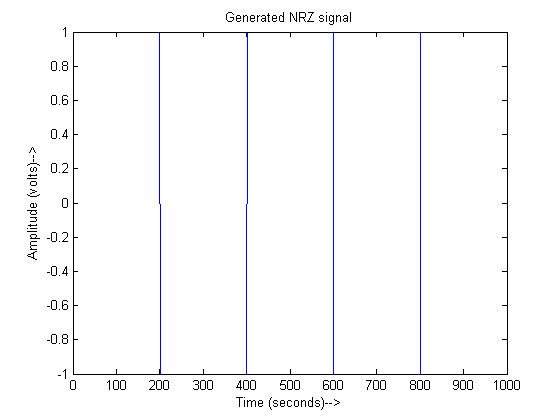
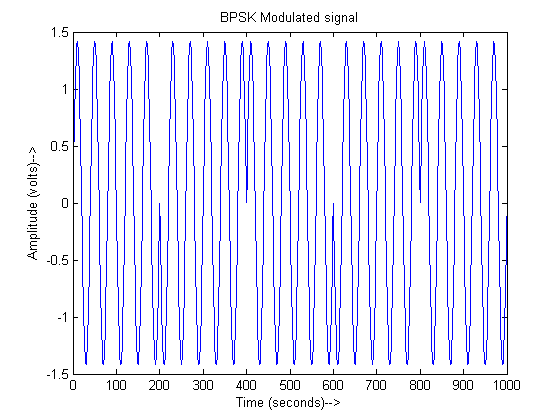
First the NRZ encoder converts these digital bits into impulses to add a notion of time into them. Then NRZ waveform is generated by up-sampling these impulses. Afterwards, multiplication with the carrier (orthonormal basis function) is carried out to generate the modulated BPSK waveform.
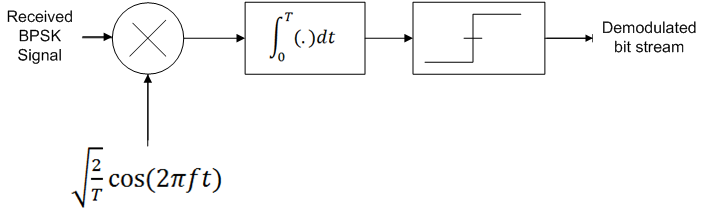
Demodulator Design:
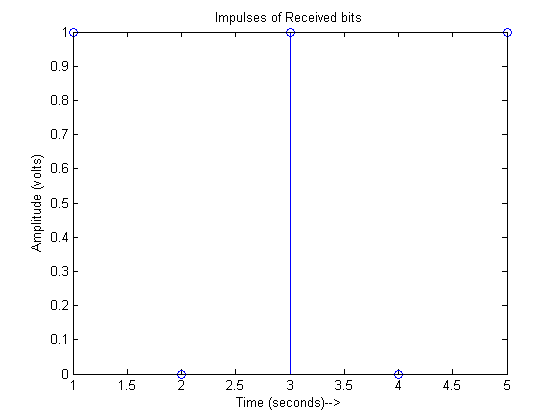
We do coherent demodulation of the BPSK signal at the receiver. Coherent demodulation requires the received signal to be multiplied with the carrier having the same frequency and phase as at the transmitter. The phase synchronization is normally achieved using Phase Locked Loop (PLL) at the receiver. PLL implementation is not done here, rather we assume perfect phase synchronization. Block diagram of BPSK modulator is shown in the figure below. After the multiplication with the carrier (orthonormal basis function), the signal is integrated over the symbol duration ‘T’ and sampled. Then thresholding is applied to determine if a ‘1’ was sent (+ve voltage) or a ‘0’ was sent (-ve voltage).
The Matlab simulation code is given below. Here for the sake of simplicity, the bit rate is fixed to 1 bit/s (i.e., T=1 second). It is also assumed that Phased Locked Loop (PLL) has already achieved exact phase synchronization.
clear all;
close all;
%Nb is the number of bits to be transmitted
T=1;%Bit rate is assumed to be 1 bit/s;
%bits to be transmitted
b=[1 0 1 0 1]
%Rb is the bit rate in bits/second
NRZ_out=[];
%Vp is the peak voltage +v of the NRZ waveform
Vp=1;
%Here we encode input bitstream as Bipolar NRZ-L waveform
for index=1:size(b,2)
if b(index)==1
NRZ_out=[NRZ_out ones(1,200)*Vp];
elseif b(index)==0
NRZ_out=[NRZ_out ones(1,200)*(-Vp)];
end
end
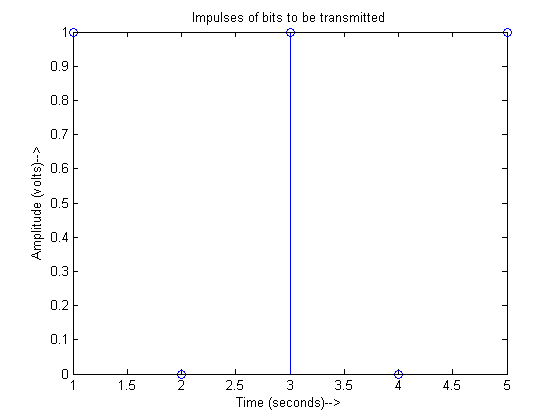
%Generated bit stream impulses
figure(1);
stem(b);
xlabel('Time (seconds)-->')
ylabel('Amplitude (volts)-->')
title('Impulses of bits to be transmitted');
figure(2);
plot(NRZ_out);
xlabel('Time (seconds)-->');
ylabel('Amplitude (volts)-->');
title('Generated NRZ signal');
t=0.005:0.005:5;
%Frequency of the carrier
f=5;
%Here we generate the modulated signal by multiplying it with
%carrier (basis function)
Modulated=NRZ_out.*(sqrt(2/T)*cos(2*pi*f*t));
figure;
plot(Modulated);
xlabel('Time (seconds)-->');
ylabel('Amplitude (volts)-->');
title('BPSK Modulated signal');
y=[];
%We begin demodulation by multiplying the received signal again with
%the carrier (basis function)
demodulated=Modulated.*(sqrt(2/T)*cos(2*pi*f*t));
%Here we perform the integration over time period T using trapz
%Integrator is an important part of correlator receiver used here
for i=1:200:size(demodulated,2)
y=[y trapz(t(i:i+199),demodulated(i:i+199))];
end
received=y>0;
figure;
stem(received)
title('Impulses of Received bits');
xlabel('Time (seconds)-->');
ylabel('Amplitude (volts)')
If you have any comments or questions, you can discuss them below.
17 responses to “BPSK Modulation And Demodulation- Complete Matlab Code With Explanation”
scatter(); %error!! -> Not enough input arguments……
Thank you very much, that is very helpful!
but, there is one problem….
scatter(); % error !! -> Not enough input arguments……..
This device can also be fight friendly this means no knife blade to slow
you down at airport security. If the integrity of the own servers is compromised with a fire inside your
workplace, an electric surge, or one thing else, the files might be destroyed.
Cloud figuring out structure enables entire discretion of users data.
Hi Dr. Moazzam,
First of all, thanks for this. I was looking for an easy to understand BPSK Matlab implementation so was glad I found this. I just have a question on the NRZ_out and Modulated plots. Shouldn’t the xlabel be samples instead of time? Because I don’t think the NRZ stream could have changed the frequency of the carrier which is what the plot seems to suggest. Hope to hear from you and thanks again.
Hi, quick question.
You specify a frequency of 5hz…but your graph shows one of about 50. Could you explain why that is?
thank you
That’s just an artifact of the plotting – plot(t, Modulated) and you would see a frequency of 5Hz.
please help ..
Problem 1.
I want to Write a code in Matlab which creates a constant envelop PSK signal waveform that generate for M=8 (M stands for modulation), so that amplitude of the signal can reach up to sqrt(2). I want to Plot a graph which showing that there is no difference except in their phases
Problem 2.
I want to Write a code in Matlab which will generate a 500 random numbers to represent our symbols; and then divide them into 4 intervals. Whereby each interval corresponds to a symbol A0, A1, A2, A3, then plot a stem of 50 random symbols generated in accordance to the interval division.
i have error in scatter plot. while BPSK modulation. whether anyone help me to correct scatterplot.
i don’t understand this part
for i=1:200:size(demodulated,2)
y=[y trapz(t(i:i+199),demodulated(i:i+199))];
end
The symbol duration is 200, here we integrate the demodulated signal with respect to i each of size 200. hope that helps!
how to make bpsk program run repeatedly?
And I am also in need of 2:1 Multiplexer. please help me with the code
this code not giving the propar phase shift .
veryhelpful,thank you
Hi Moazzam I love the code it is Tidy and very well commented, my question is: Since C++ is included within the usual MATLAB commands code how can the corresponding Simulink Block Model can be generated is there a simple way of achieving the Block Diagram at all??
Thank You
Thank you so much… I was searching for a code …. I finally found it
Hi Sushil,
Will you please share the code and your comments on the tested outcome as well. Thanks in advance.
really helpful